
Once you learn how to convert income into assets, making work optional is just a matter of time.
There are 3 main ways you can do this:
Start or buy a business.
Buy cash-flowing real estate.
Or buy a piece of ownership in companies generating profits for shareholders via stocks/ETFs.
Of course none of this is taught in schools.
But ownership is the only way to get ahead in this economy.
My name is Josh. I’m the podcast host and guy behind The Market Hustle.
I don’t come from money. I grew up in a family where the “financial lessons” I learned were what NOT to do with money.
I refused to repeat the same money patterns that caused a lot of pain in my family.
So I did what I saw the smart people were doing: I became the first person in my family to go to college.
The problem? College teaches you how to learn and can prepare you for better-paying jobs.
But it doesn’t teach you how to manage or invest money.
Which is exactly why you can be a smart person, have a well-paying job, be really good at making money, and still have no idea how to manage or grow it.
After graduating college I realized making money and managing/growing money are very different skills.
So if you're the first person in your family to take money and investing to the next level, well then you're in the right place.
My goal with this newsletter is to share what I’ve learned so you can understand money faster and avoid learning expensive financial lessons the hard way.
Because the faster you learn these lessons, the sooner you can put them to work:
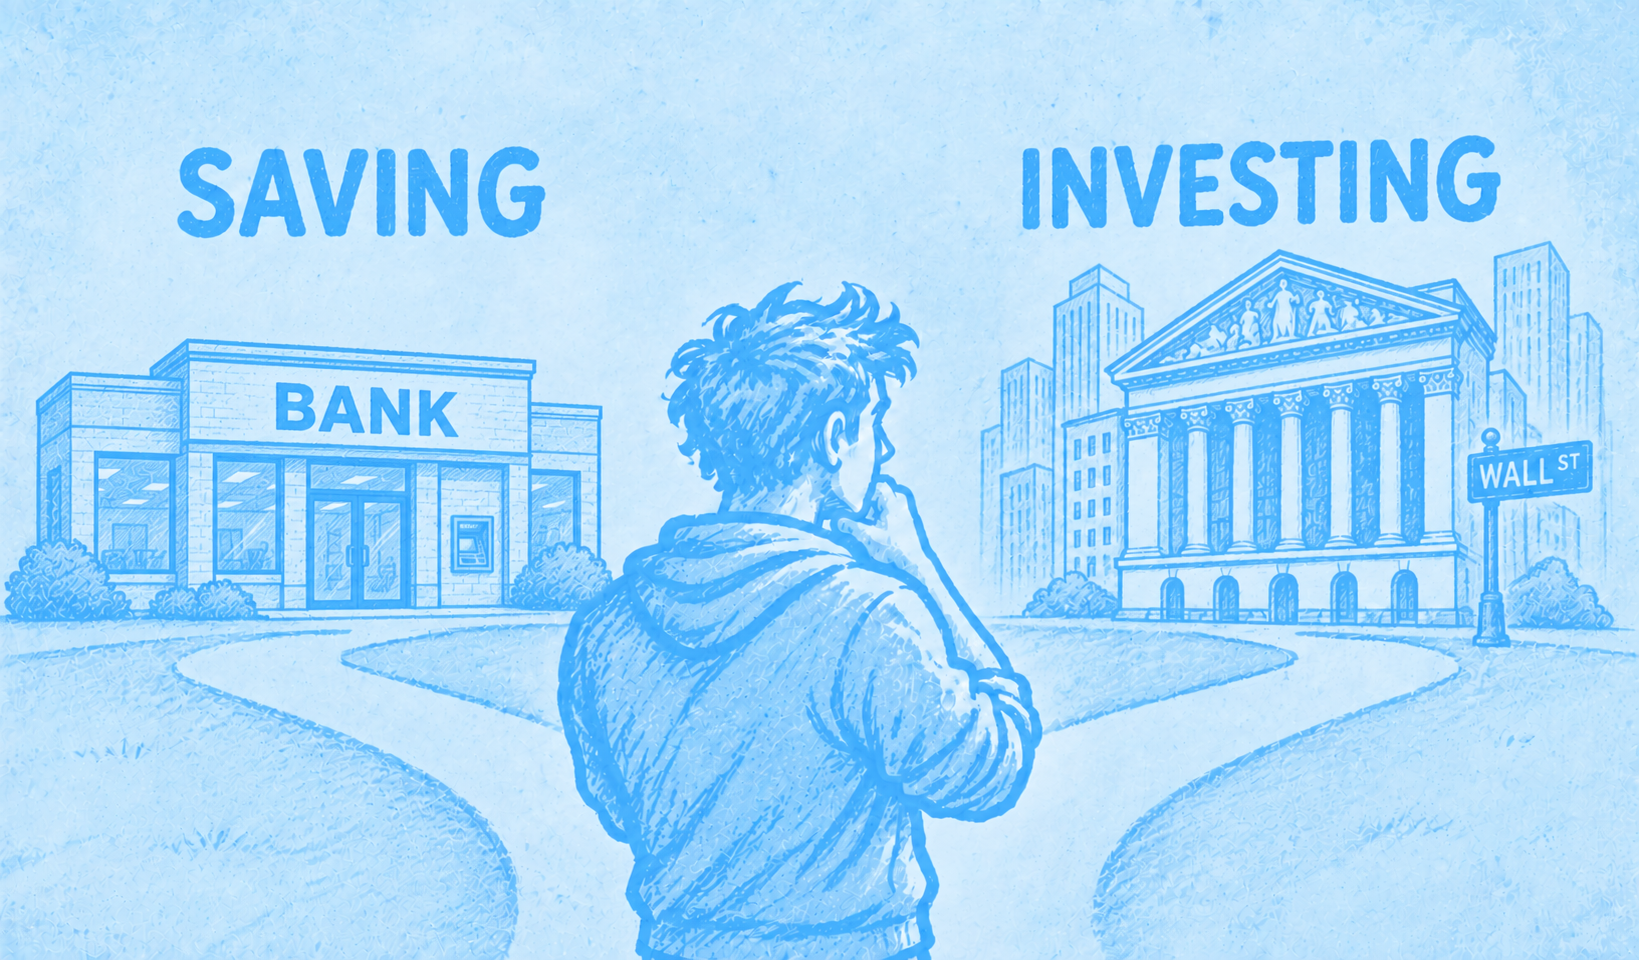
You Can’t Save Your Way To Wealth
Saving is what builds stability. Investing is what builds freedom.
Here’s an example comparing saving to earning the average return of investing in the stock market:
SAVING (earning 0%, over 15 years):
$10 each day = $54,750
$20 each day = $109,500
$30 each day = $164,250
$40 each day = $219,000
$50 each day = $273,750
$60 each day = $328,500
INVESTING (earning 10%/yr, over 15 years):
$10 each day = $115,973
$20 each day = $231,943
$30 each day = $347,912
$40 each day = $463,882
$50 each day = $579,851
$60 each day = $695,821
The numbers speak for themselves.
Your money can sit around or it can work for you.
That’s why I now treat investing like my MOST important monthly bill.
Because it is.
How Compound Interest Makes Investors Rich
Did you know that 95% of Warren Buffett’s $135 billion net worth was generated after his 65th birthday?
Compound interest is exactly what makes stock market investing so powerful.
Very simply, compound interest is the profit you earn from your profits.
So, as you might imagine, the more profits your investments earn, the more additional profits you’ll earn overall.
I have a reel that breaks down compounding more here.
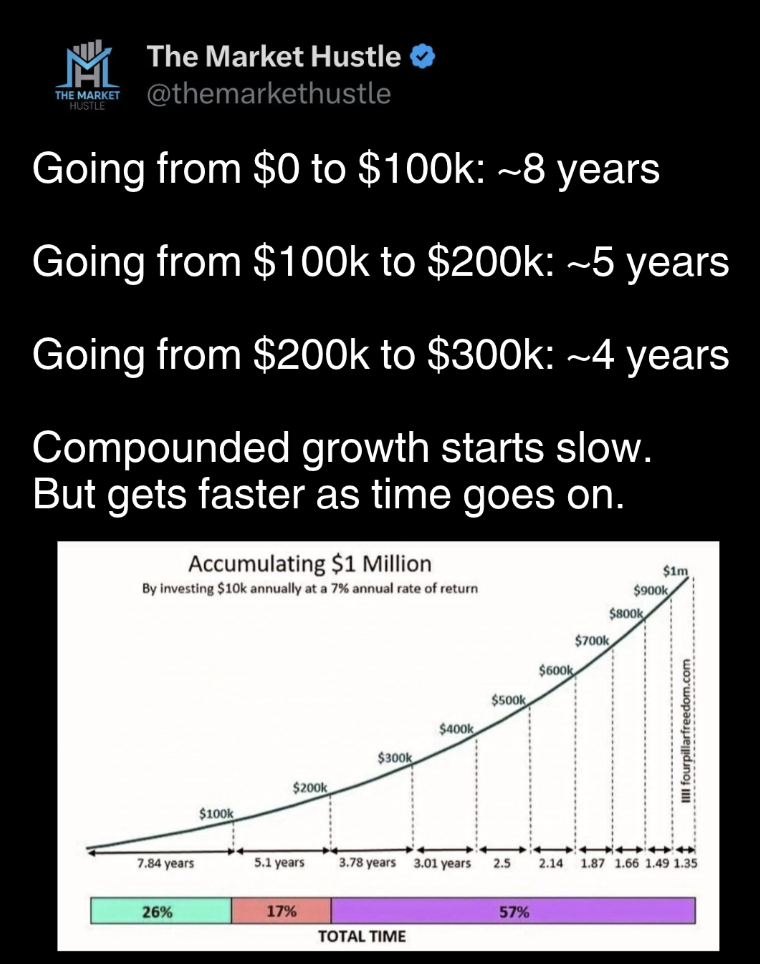
Going from $0 to $100k is harder than going from $1 million to $2 million.
Why? Because in the beginning, you are doing all the heavy lifting by contributing money consistently.
Charlie Munger famously said: "The first $100,000 is a bit*h, but you gotta do it."
The amount of money you invest matters more than your investment returns in the early stages.
Earning 10% on $1,000 is $100. (boring)
Earning 10% on $100,000 is $10,000. (more interesting)
You have to brute force your way through the early years.
Compounding growth is of course the main benefit of long-term investing.
But none of this helps you if you don’t know what to invest in or how to approach the stock market to benefit from the compounding.
Okay Josh, but what the hell do I invest in?
If you've already started investing but still find yourself wondering what to buy, how to diversify, or how your investments fit together, that's exactly what my Beyond the S&P 500 guide is designed to help you figure out.
Most people think doing well in the stock market means finding the next Nvidia or being a good day trader.
The good news? There is a much simpler way to approach the stock market without having to do any of that.
Before I explain that strategy, let me show you what the data can teach us about the stock market.
The Odds Of Picking The Winning Stocks Long-term
A finance professor from Arizona State University studied the stock market from 1926 to 2016 and found that only 4% of stocks created all the gains above treasury bills.
In other words, most stocks long-term did worse than just holding cash. Think about that for a minute.
And that checks out if we look at the top companies in the stock market today compared to 30 years ago.
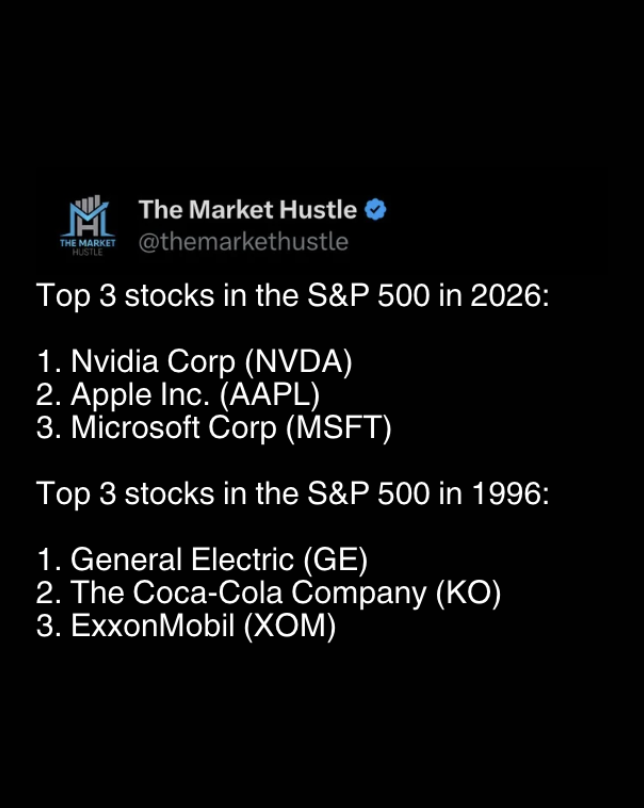
The lesson? Business leadership changes.
The best stocks today won’t always be the best stocks of the future.
The data gets even worse when we look at the track record of some of the smartest people on Wall Street who’ve made a career of trying to find the best stocks and beat the market.
In the short term, many of them can get lucky and look like they have the magic touch. But long-term, the data shows a very different story.
Around 85% to 90% of professional active fund managers fail to beat the S&P 500 over a 10 to 15-year period, according to data from S&P Dow Jones Indices (SPIVA Scorecards).
And it’s even worse for day traders… A 2020 study of Brazilian day traders found that 97% of traders who kept trading for more than 300 days lost money.
Only 1.1% of them earned more than Brazilian minimum wage.
And only 0.5% earned more than a bank teller.
A common mistake is confusing trading with investing. They're very different games.
And I’m all about playing games that put the odds in my favor.
Why Does Everyone Seem To Recommend the S&P 500?
The S&P 500 is widely recommended because it combines instant diversification across many different types of businesses, low fees, and strong historical returns to make a simple set-it-and-forget-it investment.
The S&P 500 is just a list of 500 big U.S. companies.
You can see the full list of companies in the S&P 500 here.
If you Google the S&P 500, you’ll see this:
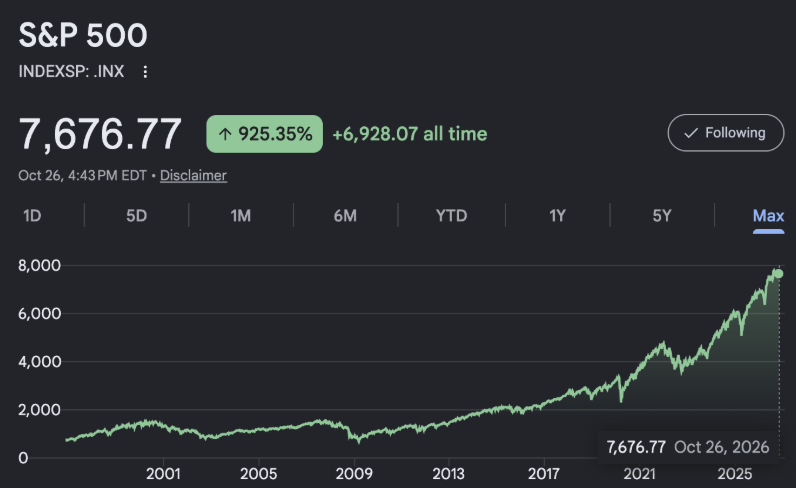
You can't buy this directly.
But you can buy a fund that copies the list.
Some examples of these funds include:
- VOO
- SPYM
- SPY
- FXAIX
You likely have a fund that tracks the S&P 500 in your 401(k) as well.
Think of these like a stock that holds all 500 companies inside the S&P 500 index.
Stock inception, if you will.
The big difference is each fund is managed and offered by a different company.
"So how much do you actually need to start investing?”
Each of these funds has its own price.
But if your stock brokerage offers fractional share purchases, you can buy a piece of them for as little as $1.
That means you can start investing in the S&P 500 without needing THOUSANDS of dollars.
If you don’t have a stock brokerage, I show how to open one here in this reel.
Buying your first ETF is the easy part.
Once you own one, the harder questions show up. How much to invest, which funds are doing which job, how diversified you really are once you count the overlap, and whether the whole portfolio supports what you're investing for.
That's what I break down step-by-step in Beyond the S&P 500.
How much has the S&P 500 historically returned?
The S&P 500 has historically returned an average of about 10% to 12% per year (with dividends reinvested), depending on the time frame measured.
Over the past 50 years, the S&P 500 has delivered an average annualized total return of approximately 11.87% (with dividends reinvested).
But that’s a long-term average annualized return.
Some years have much higher gains. Some years have lower gains. Some years end with negative returns (market drops or bear markets) as seen below:
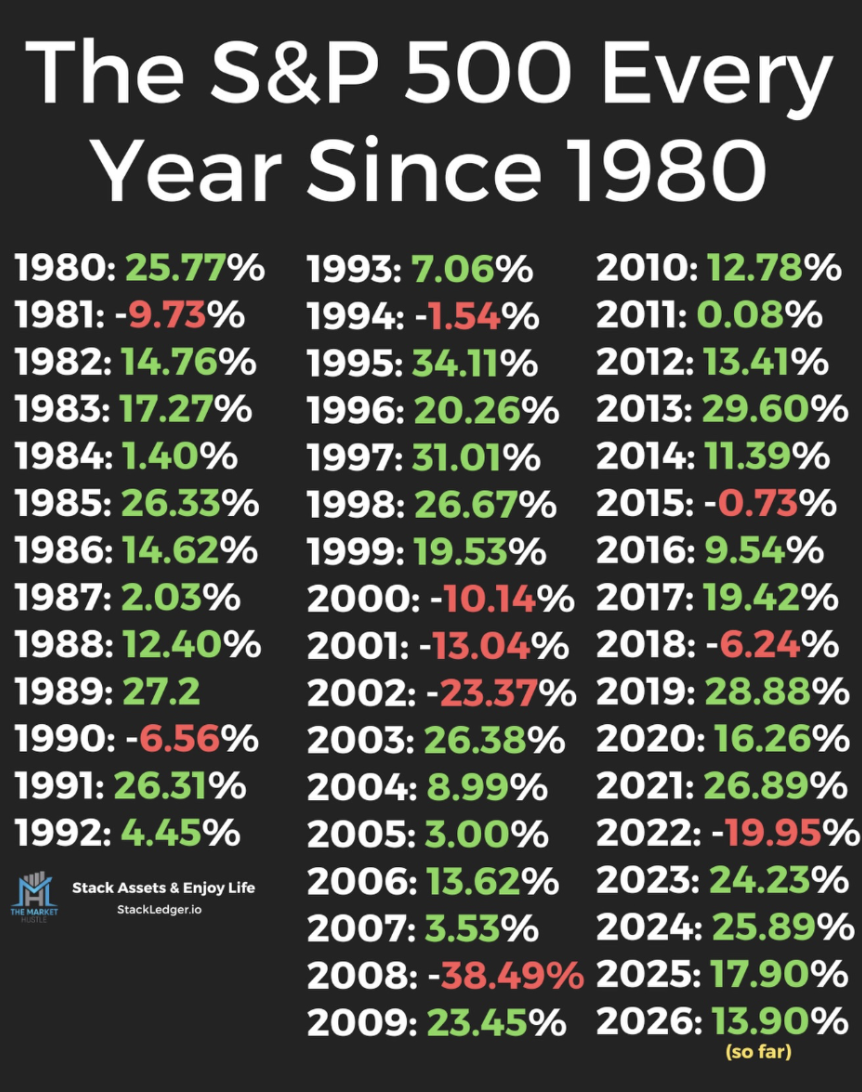
This is another reason why we want to approach the stock market with a long-term mindset.
And why I don’t put any money in the stock market that I need in 5 years or less.
When we add money into the stock market, we should have the intention of keeping it working in the market for the next decade or longer.
That’s how we get compounding working in our favor.
The Odds Of Predicting The Stock Market
The common advice is to buy low and sell high and get out before the stock market crashes.
But this is a lot easier said than actually done in the short term.
Over the last 25 years, there have been 4 major market crashes:
- Dot-com bubble (2000)
- Housing crisis (2008)
- COVID panic (2020)
- Interest rate shock (2022)
And there will be more market crashes over the next 25 years.
There will be another 10% dip...
There will be another 20% correction...
There will be another 50% crash...
The problem is accurately predicting exactly when they’ll happen is nearly impossible.
More money has been lost waiting for a market crash and missing the gains than in the crashes themselves.
You can only prepare for and embrace them.
Historically they've been massive opportunities if you stuck to a plan and stayed consistent with investing.
The prediction game says: "Wait for the dip. Sell before it drops. Buy back at the bottom."
It sounds smart. But in practice it's very difficult to do because you have to be right twice.
First, when to sell
And second, when to buy back in.
You’d have to get both right, every single crash.
Almost no one does.
The ownership game says: "Make investing a habit and hold through the noise."
You just have to not quit and play the long game.
The easiest way to do this is by dollar-cost averaging. (I made a reel on it here)
That means you make investing a habit and invest a set amount of money into the same investment regularly (such as every paycheck, every month or week).
This strategy:
- Eliminates market timing
- Reduces emotional investing
- Automatically buys more shares when prices fall and fewer when prices rise.
Let's say you invest $400 into the same stock or fund every month:
One month, it's $800/share so you get 0.5 shares.
Next month, it drops 50% to $400/share so now you get 1 full share.
Same $400 but during dips you get more shares for your money.
Dollar-cost averaging turns market selloffs into automatic discount shopping.
Here's what happens when you DON'T have a strategy:
March 2020: Market drops 30%.
You: "I'll wait until it bottoms..."
6 months later: Market recovers 60%.
You: "I missed it. I'll wait for the next dip."
The next market dip occurs:
You: "I'll wait until it bottoms...”
Break this cycle. Start playing the ownership game instead of watching the stock market like a trader.
Meet Bob. The Unluckiest Investor Alive.
He invested $10,000 right before every major crash of the last 26 years.
2000, 2008, 2020, and 2022
Four buys. Each one the day before a crash.
His portfolio today: over $138,000.
$40,000 invested at the worst possible moments in modern history.
Worth over $138,000 today. Or a 245% return before dividends.
He held through two recessions, multiple crashes, and a global pandemic.
He just never sold.
Think about that for a minute…
So how does that work?
Because the S&P 500 isn't a fixed list of companies. Think of it like a filter.
It rebalances four times a year.
Companies that stop performing get booted and replaced by better ones.
Only 53 of the original 500 are still in it, so 447 companies were replaced.
And through all that turnover, the index still averaged roughly 10% per year.
In 1990 tech was 6% of the index. Today it's 38%.
No single person voted on that. The filter did it automatically.
You don't have to pick the winners. The index evolves as companies enter and leave, so you don't have to select every company yourself.
So… how much do you need invested to live off of your investments?
A common starting target for financial freedom is 25x your annual living expenses, based on the 4% withdrawal rule.
To get this number, you first multiply your monthly expenses by 12 to figure out your annual expenses.
You then multiply that annual expense by 25 to get your financial freedom number.
This number is based on the idea of living off 4% of your portfolio each year, made famous by the Trinity Study.
That’s a research paper by 3 finance professors at Trinity University (Philip L. Cooley, Carl M. Hubbard, and Daniel T. Walz) that researched safe retirement withdrawal rates from investment portfolios during some of the worst stock market environments (like the Great Depression).
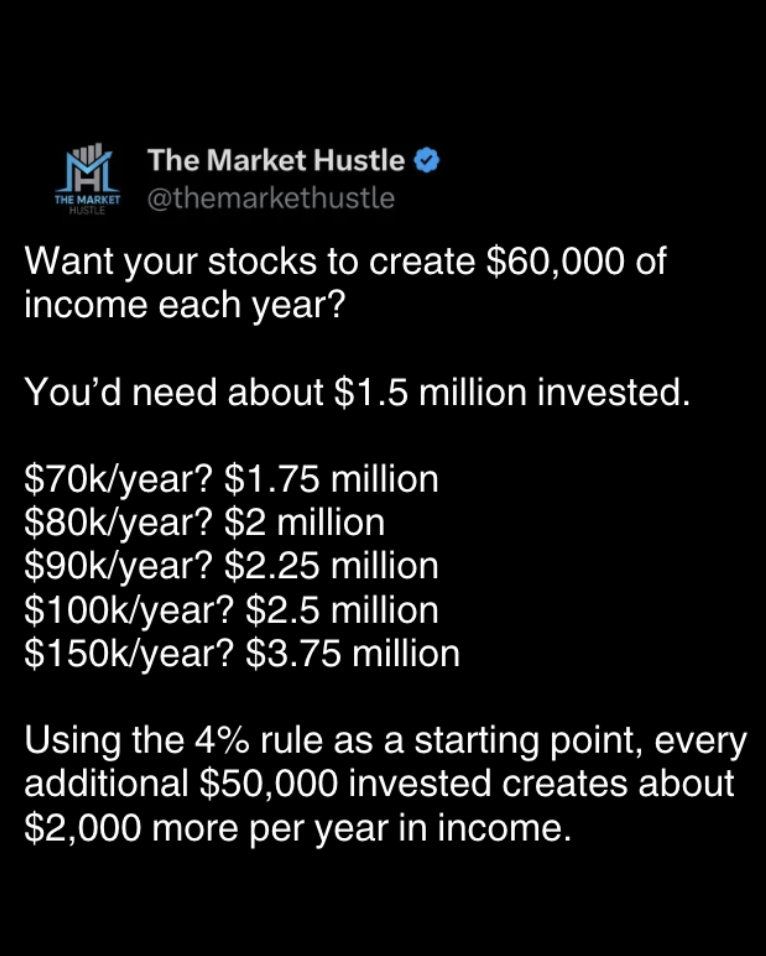
Building a million+ portfolio can feel far away when starting. So don't start there.
Think of it as deleting bills one at a time:
Level 1: Subscriptions = ~$15k invested
Level 2: Your insurance = ~$50k invested
Level 3: Your groceries = ~$250k invested
Every bill your portfolio covers is one less bill your job has to cover.
You now know the difference between making money and growing money.
You now understand the power of long-term investing.
You now understand the odds of picking stocks and day trading.
Now the question is, what are you going to do with it?
Skills aren't built by just thinking about them.
They're built by making moves.
Your money won’t grow by only reading and thinking about it.
You have to get in the game to get rewarded.
But understanding investing and applying it to your own money are 2 different skills.
You can know everything in this newsletter and still not have a framework for your own portfolio.
Here’s a few ways I can help:
If you're ready to stop guessing and start building a long-term portfolio you understand, my 186-page Beyond the S&P 500 guide will help you work through the process step-by-step.
If you make $100k+ and want 1:1 help building your financial system, I offer limited 1:1 educational coaching spots each month. You can apply here.
